Trouble Pen display in Process Analyst

Hello Everbody

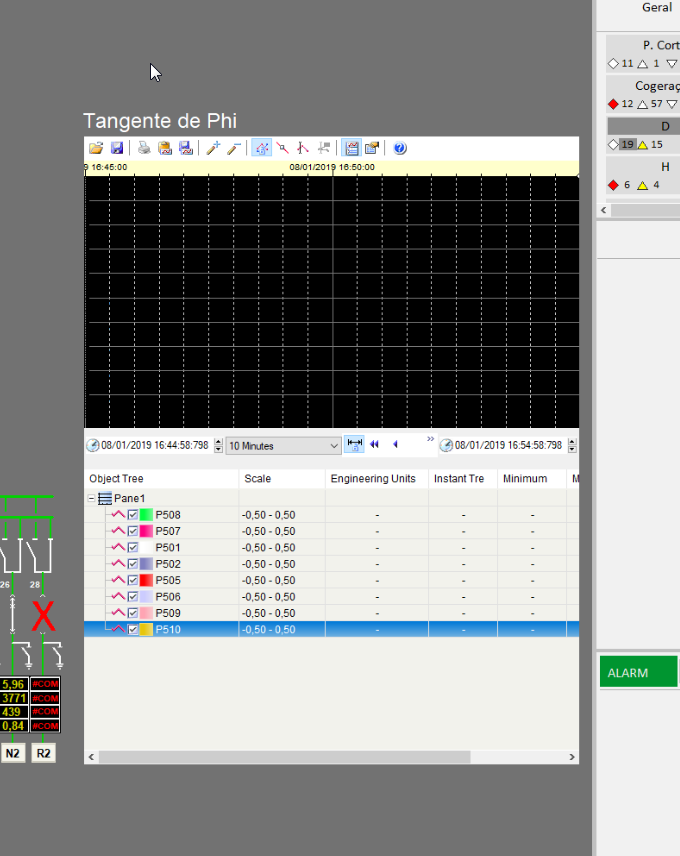
I configured a trend in process analyst object with fixed pens (8 fixed pens).

In runtime, the trend display in process analyst doesn't display the trends.

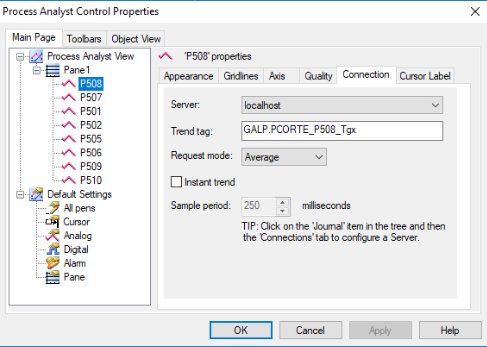
You can see in picture below the connection configuration of pen (GALP is a cluster difened in this project)

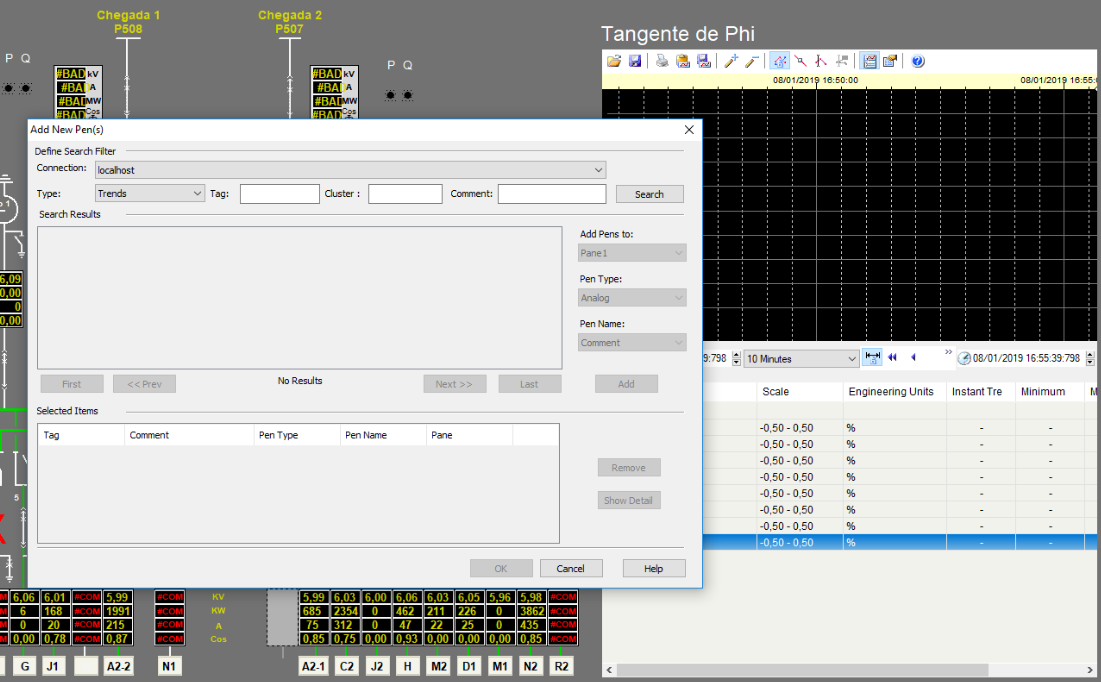
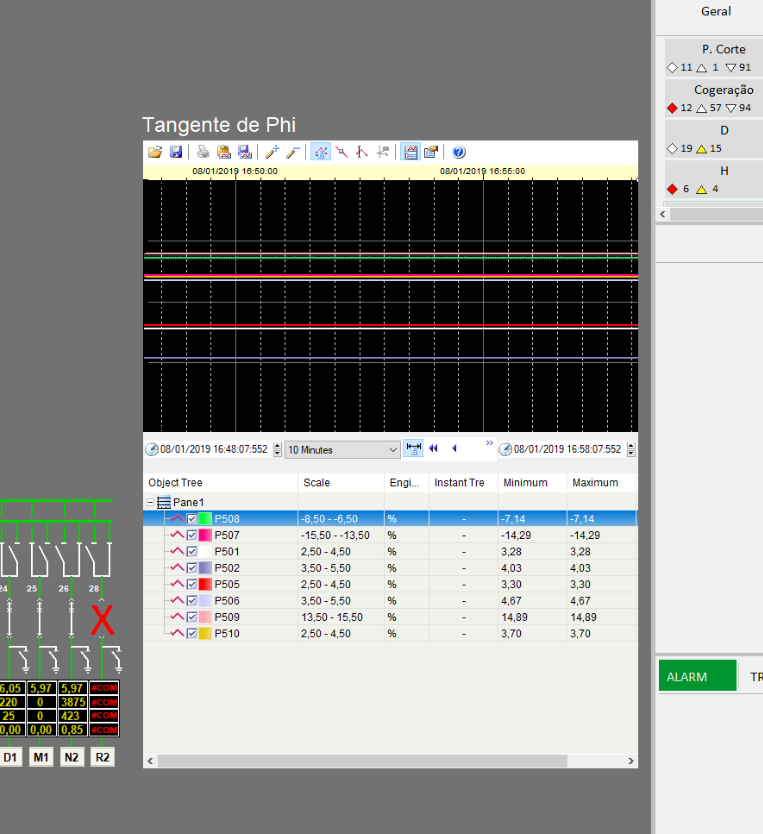
as soon as i press in "add pen button" the trends start showing.

I would like to understand why is the trouble that avoid the pens display in panel on process analyst.

Thank you 

Miguel

  • Hi Miguel,
    It can be helpful to mention the version of Citect you are using, just in case it is a known issue and we can share a version with the fix.
    I am assuming you are loading the pens using cicode? There can sometimes be a race condition of the page initializing and the ActiveX control (Process Analyst) making its connections and initializing. I'd recommend adding this cicode function call to Page Property 'On page shown' which ensures everything is finished loading before it starts working on the ActiveX control.
    Here is sample cicode which should help you load a pav file with the pens defined:
    FUNCTION ConfigureAnalyst()
    ErrSet(0);
    OBJECT hAnalyst = ObjectByName("AN502");
    _ObjectCallMethod(hAnalyst, "LoadFromFile", "TrendPens.pav", 0);
    OBJECT hToolbars = _ObjectGetProperty(hAnalyst, "Toolbars");
    OBJECT hMainToolbar = _ObjectCallMethod(hToolbars, "get_Item", 1);
    OBJECT hPanes = _ObjectGetProperty(hAnalyst, "Panes");
    OBJECT hPane1 = _ObjectCallMethod(hPanes, "get_Item", 1);
    OBJECT hPens = _ObjectGetProperty(hPane1, "Pens");
    OBJECT hPen1 = _ObjectCallMethod(hPens, "get_Item", 1);
    _ObjectCallMethod(hPen1, "HorizontalScrollBy", -0.3);
    _ObjectCallMethod(hPen1, "Select");
    IsError();
    ErrSet(1);
    END

    Let me know how you go. It does seem like the browse tags makes the Connections valid again.
    Kind regards
    Olivier
  • Hi Miguel,

    That certainly is strange.

    When you say configured, is this a page that you created in Graphics Builder and manually configured up 8 pens and typed in the connection info? Or are they populated via cicode as Oli mentioned?

    Can you turn on the 'Error' column in the PA and see if that is indicating a specific error?

    Cheers,

    bradley

  • Hello Olivier

    Thank you for your answer. we are using the new version 2018.

    I configured the pens in page configuration (create a pane and add pens manually in configuration). With this, i didn't to use a cicode function.

    So, to solve the problem i develop the function, similar a example that you sent to me, and works.

    However, I would like to see what has been misconfigured.

    For example, i run the same project in my laptop (demo mode), and the trends appears correctelly... strange

    Regards

    Miguel
  • Hi Miguel, I did a quick test with my 2018 installation and added a PA to the test page of the ExampleSA project and configured the pens to point to a couple of the trends (Cluster1.<trend tag name>) from that project. That worked. The fact that the same project works on a laptop is positive. Are you able to delete the data folder on the problematic computer and then retest? (Make a copy of it first just in case you need anything from there) Perhaps there is something in there causing a problem.