MS Chart in OMI

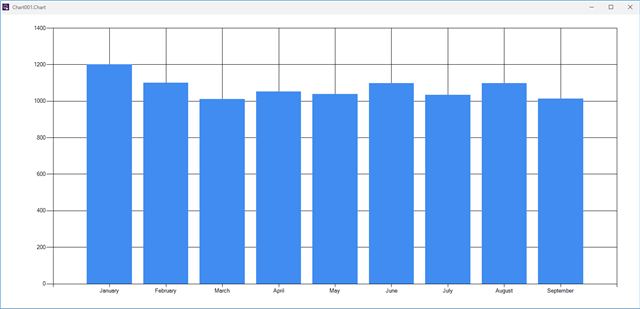
We have imported MSChart as a OMI APP but now battling to get it to draw/show any chart except the chart name I provide. It is like the chart area does not exist.

Is there anyone that has got this working that are willing to share an example.

Any other charting options for OMI will also be welcome.

Thanks!

Parents
  • Hi Mark, 
    When you state that you have imported MSChart as an OMI App, did you wrap/create that yourself or did you import the Microsoft Windows Forms library, that contains the Chart App?

    I can provide some examples, on a scenario where I have tested this, don't know if it applies to your own solution, bit it might be a start =)

    There are several other trending options, especially if you start looking into Web Widgets.

    You need to start by adding the chart area (Ie on show)

    MyContent.Chart1.ChartAreas.Add("Trend");

    'Additional chart configuration 

    MyContent.Chart1.ChartAreas[0].BackColor = intensity1;
    MyContent.Chart1.ChartAreas[0].AxisX.LabelAutoFitStyle = System.Windows.Forms.DataVisualization.Charting.LabelAutoFitStyles.None;
    MyContent.Chart1.ChartAreas[0].AxisX.LabelStyle.IntervalType = System.Windows.Forms.DataVisualization.Charting.DateTimeIntervalType.Minutes;
    MyContent.Chart1.ChartAreas[0].AxisX.LabelStyle.Format = "HH:mm";
    MyContent.Chart1.ChartAreas[0].AxisX.LabelStyle.Font = new System.Drawing.Font("Roboto", 7);
    MyContent.Chart1.ChartAreas[0].AxisX.LineWidth = 3;
    MyContent.Chart1.ChartAreas[0].AxisX.LineColor = fencing;
    MyContent.Chart1.ChartAreas[0].AxisX.TitleForeColor = intensity4;
    MyContent.Chart1.ChartAreas[0].AxisX.LabelStyle.ForeColor = intensity4;
    MyContent.Chart1.ChartAreas[0].AxisX.MajorGrid.LineColor = fencing;
    MyContent.Chart1.ChartAreas[0].AxisX.MinorGrid.LineColor = fencing;

    MyContent.Chart1.ChartAreas[0].AxisY.LineColor = fencing;
    MyContent.Chart1.ChartAreas[0].AxisY.TitleForeColor = intensity4;
    MyContent.Chart1.ChartAreas[0].AxisY.LabelStyle.Font = new System.Drawing.Font("Roboto", 7);
    MyContent.Chart1.ChartAreas[0].AxisY.LabelStyle.ForeColor = intensity4;
    MyContent.Chart1.ChartAreas[0].AxisY.MajorGrid.LineColor = fencing;
    MyContent.Chart1.ChartAreas[0].AxisY.MinorGrid.LineColor = fencing;
    MyContent.Chart1.ChartAreas[0].AxisY.LabelStyle.Format = "D";

    then in your script to add data to chart

    MyContent.Chart1.Series.Add("Series1");
    MyContent.Chart1.Series[0].ChartArea = MyContent.Chart1.ChartAreas[0].Name;
    MyContent.Chart1.Series[0].Color = System.Drawing.Color.FromArgb(255, 0, 122, 204);
    MyContent.Chart1.Series[0].ChartType = System.Windows.Forms.DataVisualization.Charting.SeriesChartType.Column;
    MyContent.Chart1.Series[0].XAxisType = System.Windows.Forms.DataVisualization.Charting.AxisType.Primary;
    MyContent.Chart1.Series[0].YAxisType = System.Windows.Forms.DataVisualization.Charting.AxisType.Primary;
    MyContent.Chart1.Series[0].XValueMember = "FromValue";
    MyContent.Chart1.Series[0].YValueMembers = "Cnt";

    MyContent.Chart1.Series.Add("Series2");
    MyContent.Chart1.Series[1].ChartArea = MyContent.Chart1.ChartAreas[0].Name;
    MyContent.Chart1.Series[1].Color = System.Drawing.Color.FromArgb(255, 52, 52, 52);
    MyContent.Chart1.Series[1].BorderWidth = 2;

    MyContent.Chart1.Series[1].ChartType = System.Windows.Forms.DataVisualization.Charting.SeriesChartType.Spline;
    MyContent.Chart1.Series[1].XAxisType = System.Windows.Forms.DataVisualization.Charting.AxisType.Primary;
    MyContent.Chart1.Series[1].YAxisType = System.Windows.Forms.DataVisualization.Charting.AxisType.Primary;

    MyContent.Chart1.Series[1].XValueMember = "FromValue";
    MyContent.Chart1.Series[1].YValueMembers = "WeightedNormal";

    'In this case data is contained in a dataset.

    MyContent.Chart1.DataSource = ds.Tables[0].DefaultView;
    MyContent.Chart1.DataBind();

    MyContent.Chart1.ChartAreas[0].RecalculateAxesScale();
    MyContent.Chart1.ChartAreas[0].AxisY.RoundAxisValues();


  • I'm getting error "non static method requires a target" for 

    MyContent.Chart1.DataSource = ds.Tables[0].DefaultView;
    MyContent.Chart1.DataBind();

  • Hi, The above example is not complete and includes some assumptions, and just gives an indication on how it can be used.

    So in the example you need to make sure that your dataset actually contains data, the assumption in above example was that you retrieve data for your dataset in some way. 

    I have also removed the dependency for System.Drawing.Color to make it even more simple, but you eventually need this if you want to manually set colors.

    This code will be more usable if you just want a copy-paste solution in a layout to start with.

    MyContent.Chart1.ChartAreas.Add("Chart");

    'Add data to chart
    MyContent.Chart1.Series.Add("Series1");
    MyContent.Chart1.Series[0].ChartArea = MyContent.Chart1.ChartAreas[0].Name;
    MyContent.Chart1.Series[0].ChartType = System.Windows.Forms.DataVisualization.Charting.SeriesChartType.Column;
    MyContent.Chart1.Series[0].XValueMember = "Month";
    MyContent.Chart1.Series[0].YValueMembers = "Avg";

    'In this case data is contained in a dataset, lets create dummy data for the example to work
    dim ds = new System.Data.DataSet;
    dim dt = new System.Data.DataTable();
    dt.Columns.Add("Month");
    dt.Columns.Add("Avg");
    dt.Rows.Add("January", 1200.324);
    dt.Rows.Add("February", 1100.456);
    dt.Rows.Add("March", 1011.277);
    dt.Rows.Add("April", 1051.952);
    dt.Rows.Add("May", 1037.388);
    dt.Rows.Add("June", 1097.932);
    dt.Rows.Add("July", 1034.246);
    dt.Rows.Add("August", 1098.924);
    dt.Rows.Add("September", 1012.246);
    ds.Tables.Add(dt);

    'Data is now prepared, time to put it to use
    MyContent.Chart1.DataSource = ds.Tables[0].DefaultView;
    MyContent.Chart1.DataBind();

    '(Optional) Recalculate minimum and maximum values for axes
    MyContent.Chart1.ChartAreas[0].RecalculateAxesScale();

    '(Very optional) Rounds the axis values to cleaner, more human-friendly numbers.
    MyContent.Chart1.ChartAreas[0].AxisY.RoundAxisValues();

Reply
  • Hi, The above example is not complete and includes some assumptions, and just gives an indication on how it can be used.

    So in the example you need to make sure that your dataset actually contains data, the assumption in above example was that you retrieve data for your dataset in some way. 

    I have also removed the dependency for System.Drawing.Color to make it even more simple, but you eventually need this if you want to manually set colors.

    This code will be more usable if you just want a copy-paste solution in a layout to start with.

    MyContent.Chart1.ChartAreas.Add("Chart");

    'Add data to chart
    MyContent.Chart1.Series.Add("Series1");
    MyContent.Chart1.Series[0].ChartArea = MyContent.Chart1.ChartAreas[0].Name;
    MyContent.Chart1.Series[0].ChartType = System.Windows.Forms.DataVisualization.Charting.SeriesChartType.Column;
    MyContent.Chart1.Series[0].XValueMember = "Month";
    MyContent.Chart1.Series[0].YValueMembers = "Avg";

    'In this case data is contained in a dataset, lets create dummy data for the example to work
    dim ds = new System.Data.DataSet;
    dim dt = new System.Data.DataTable();
    dt.Columns.Add("Month");
    dt.Columns.Add("Avg");
    dt.Rows.Add("January", 1200.324);
    dt.Rows.Add("February", 1100.456);
    dt.Rows.Add("March", 1011.277);
    dt.Rows.Add("April", 1051.952);
    dt.Rows.Add("May", 1037.388);
    dt.Rows.Add("June", 1097.932);
    dt.Rows.Add("July", 1034.246);
    dt.Rows.Add("August", 1098.924);
    dt.Rows.Add("September", 1012.246);
    ds.Tables.Add(dt);

    'Data is now prepared, time to put it to use
    MyContent.Chart1.DataSource = ds.Tables[0].DefaultView;
    MyContent.Chart1.DataBind();

    '(Optional) Recalculate minimum and maximum values for axes
    MyContent.Chart1.ChartAreas[0].RecalculateAxesScale();

    '(Very optional) Rounds the axis values to cleaner, more human-friendly numbers.
    MyContent.Chart1.ChartAreas[0].AxisY.RoundAxisValues();

Children
No Data