

“The short answer: A seven-day forecast can accurately predict the weather about 80 percent of the time and a five-day forecast can accurately predict the weather approximately 90 percent of the time. However, a 10-day—or longer—forecast is only right about half the time.” – SciJinks (https://scijinks.gov/forecast-reliability/)
Do you believe those statements? What’s your experience of weather forecasting in your day-to-day life? If it is anything like mine it is something like:
Partner: “What’s the weather going to be like today?”
Me: “According to the forecast on my phone it’s going to be cool with showers.”
Partner: “Huh, my phone says it’s going to be dry and a little warm.”
Me: “Let me check another website to see what it says.”
Partner: “Alexa, what’s the weather today?”
Then we pack for both wet and dry weather, warm and cool - which in Scotland, where I live, should be the default anyway.
I have been working with PI for over twenty years. My origin story is that I fell into it after an ex-colleague recommended me to an OSIsoft partner and after a successful interview my journey began with a CD-ROM training for PI-ProcessBook. I have come a long way since then. I have developed an obsession with time-series data. Anyone who I have delivered a workshop or a demo to will have likely seen my smart home that feeds around five thousand data streams into my home PI system.
That smart home data is used to automate decisions that save energy, reduce workload, and solve problems. Just like our customers do in their businesses. One of the latest innovations I had is to use the forecast temperature to suppress the heating coming on in the morning.
Looking at the data collected in my PI system I could see that the temperature of the house would drop overnight and occasionally just low enough that the heating would be active in the morning for a short period of time. If the heating had remained inactive the temperature of the day would have been enough to warm the house. Wasted energy, wasted money, extra run-time of equipment not needed. PI solves these problems.
Here’s the challenge to solve:
If I can accurately predict the local temperature, I can instruct the heating to remain inactive.
PI helped me identify which weather service provides the most accurate temperature forecast for the location of my house.
How can we use PI to test forecasts?
To test any forecast, two metrics are required: predicted and measured results.
The measured result is easy. I mentioned my obsession with time-series data. I have a weather station on my property that measures temperature, humidity, pressure, wind, etc. and sends the data to an MQTT broker.
Using the Adapter for MQTT that data is collected and stored in my PI server. Here is the last month:
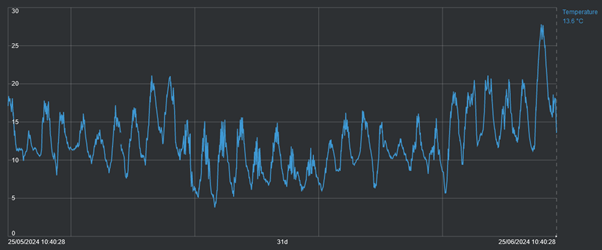
That spike at the end – that’s a record temperature recorded in my PI system. You can it is far above the average high which is around 11 degrees Celsius at this time of year.
We need the predictions to compare with the actual measurements. There are many weather services that provide forecast data through APIs. In the OSIsoft Github there are examples of collecting weather data using the PI Connector for UFL. See: (https://github.com/osisoft/PI-Connector-for-UFL-Samples/tree/master/COMPLETE_SOLUTIONS/OpenWeather)
However, in the latest release of the PI Web API (2023 SP1) support for “OMF PI Points with Future Data” was included in the enhancements. As I am already using the adapter framework the OMF endpoint for PI is already available. To collect the forecast data the tools I need are already available in my environment so I opted for this method instead of installing the PI Connector for UFL.
The plan is to use some preinstalled middle-ware to interact with the APIs of a few weather services to get the forecast temperature. OMF will be used to create the future PI points required to store the data, and it will also be used to periodically send the forecast values to PI. With the data in PI, it can be compared to the measured temperature to see which weather service is most accurate for my specific location.
The weather services that we will collect forecasts from are:
AccuWeather: https://www.accuweather.com
Meteorologist Instututt (MetNO): https://www.met.no/en
Tomorrow.io: https://www.tomorrow.io/
This will not be an endorsement of any of these weather services. This solution will just help me identify the weather service that is most accurate for my specific location.
To send data to PI using OMF the PI Web API needs to be installed with the OMF endpoint enabled. Once installed, and security is in place, we only need to use HTTP POST commands to send configuration and data requests, which will be automatically processed by the PI system. If you are developing a custom data collection using OMF you should also consider using Edge Data Store as an intermediate location to provide store-and-forward functionality out of the box.
There are three distinct steps required to send data via OMF (and the steps are agnostic to if you are sending data to PI, or to Edge Data Store, or CONNECT Data Services).
- Define and create an OMF type
- Define and create an OMF container
- Define and create OMF data
Simply, the type will define the structure of the data to be stored, the container will initialize storage (in the case of PI this will be PI points) and data will feed into the storage container.
The OMF type for the forecast is simple – a timestamp index and a floating -point number. There are many examples in the OMF documentation on creating types of this kind. (see Open Message Format (OMF)).
With a type created the next step is to create a container for each weather service that is to be tested. To enable “future” PI points when creating the container we must indicate this in the metadata. Here is an example of creating a container with future PI points:
[
{
"id": "Weather.AccuWeather.Forecast.Temperature",
"typeid": "TimeIndexed.Single",
"metadata": {
"future": true
}
}
]
Finally, for each weather service an API request is sent on an hourly basis and the twelve hour ahead temperature forecast is sent to OMF.
Here we hit upon our first problem that PI can easily solve. AccuWeather provides temperature data by default in Fahrenheit, whereas MetNO and Tomorrow.io provide the data by default in Celsius. The measured temperature from the weather station is also in Celsius.
To solve this, the data is stored in PI in its native unit of measurements, but to compare the data Asset Framework is used to normalize the data in Kelvin.
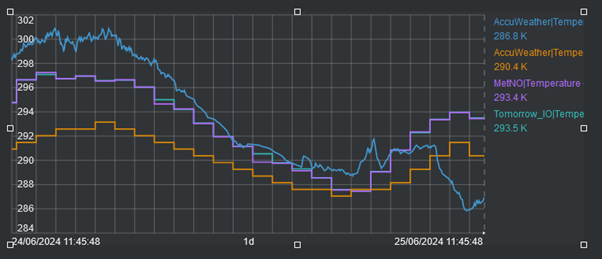
We do this by specifying the Source Units as appropriate for the data service in the PI Point Data Reference:
AccuWeather

MetNO, Tomorrow.io, and local weather station
In the Element Template used to structure the data, and provide us with a means to run analytics to compare the data, the Default UOM is set to Kelvin.

This allows us to compare the values across a consistent scale.
With this in place we have the data needed to make the analysis. To make the analysis we will use Asset Framework to provide two metrics, which will give a comparison of the data services forecasts against the recorded measurements.
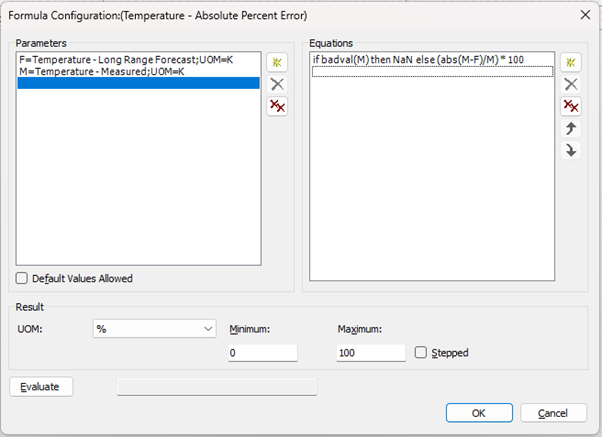
1. Absolute Percent Error – this works because all measurements are normalised in Kelvin
Using a Formula data reference: Absolute of Measured Temperature minus Forecast Temperature divided by Measured Temperature, expressed as a percentage:
2. Mean Absolute Percent Error – to give a summary of accuracy over a period.
Using an Expression Asset Analytic: Average the Average Percent Error for 24 hours.
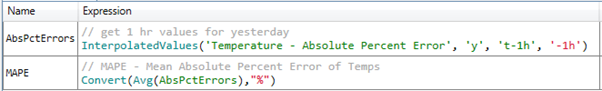
The result of these summaries is that we have a clear method to compare how accurate the forecasts are over a twenty-four-hour period, which we can analyze over longer periods of time.
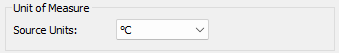
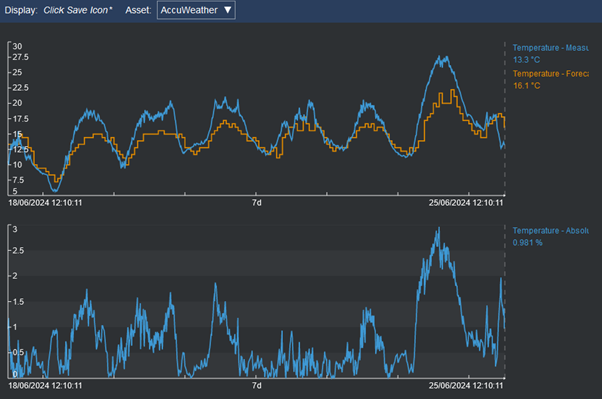
Using PI Vision to review the data, and switching the assets between the three weather services, the forecasts are all seen to be good, but MetNO and Tomorrow.io appear to be a little more accurate for my location. Despite working in Kelvin to perform the summaries, being in Europe it is much easier to understand the temperature in Celsius. PI Vision allows us to change the display unit of measure so the displays are easy to read.
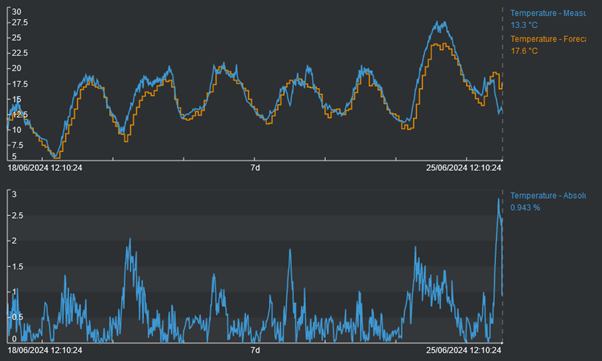
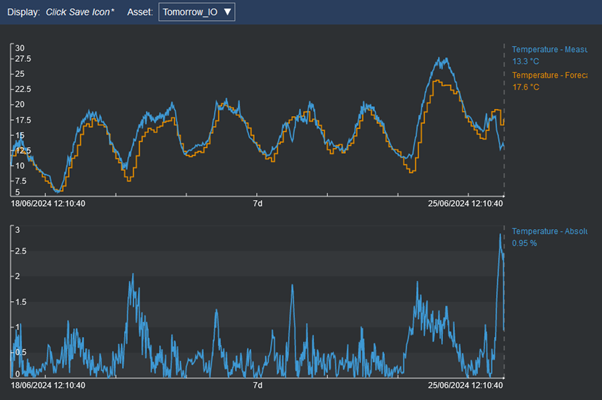
The trends show that MetNO and Tomorrow.io are very close but it is not obvious which is more accurate on average. Using the MAPE result to compare MetNO and Tomorrow.io shows that Tomorrow.io is probably marginally more accurate.
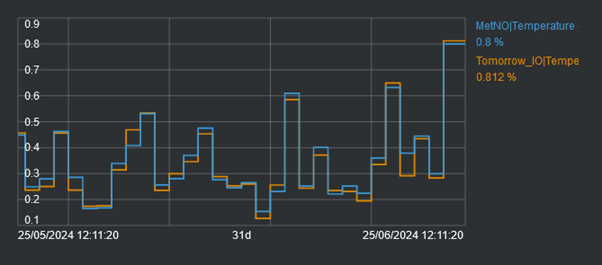
And, using the summary functionality in PI Vision we can show that is true – Tomorrow.io is marginally more accurate than MetNO at an average of 0.344 to 0.353.

It is probably marginal enough that they could be considered equally good at forecasting the temperature twelve hours out.
Where does this leave my solution?
If I can accurately predict the local temperature, I can instruct the heating to remain inactive.
Yes, I can accurately predict the local temperature using preferably, in my location, either the Tomorrow.io or the MetNO weather service.
Yes, I did reduce the number of occasions when the heating would have been active in the morning. I can prove this with the Event Frames I have setup in the system, but that’s a whole other blog.
What I have shown though is that the AVEVA PI can easily be used to prove out forecasts or help compare different forecast models to identify the most useful for your specific use case.
Please, share any of your own experiences in forecasting, and how PI has helped you or your ideas for using PI for forecasting.


