

How to deal with PI Message Logs
Overview:
You are facing an issue with your PI System, a PI Client or a PI Interface? You like to understand why things are not working as expected? Does PI tell you what's going on? E.g. why PI ProcessBook running on your client machine isn't able to connect to your remote PI System?
Yes, it does! This post is intended to help you dealing with PI Message Logs.
Please also pay attention to OSIsoft KB Article # 3248OSI8 and the belonging video at Youtube.
1. Logging in PI
The most relevant log when working with PI is the PI Message Log. In this post I will focus on PI Message Logs but first let's take a look at the available logs:
1.1 pipc.log
The pipc.log is the traditional log file being used by PI API based applications like PI ProcessBook earlier than version 3.x and Interfaces to the PI System. UNIINT (a framework for OSIsoft Interfaces to the PI System) based interfaces compiled against UNIINT versions later than 4.5.x are logging to the PI Message Log. If and what UNIINT version was used can either be verified with the Interface manual belonging to a particular interface release or within the PI Interface Configuration Utility (ICU). When an interface (instance) configuration is loaded into the ICU the UNIINT version is displayed below the configuration ComboBox.
With PIPC Log Migration enabled (Migratelog=1 in pipc.ini) all pipc.log messages will be forwarded to the PI Message Log.
The PIPC Log Server service maintains (shifts, recycles) the pipc.log files and uses settings provided with pipc.ini (e.g. MAXPIPCLOGS and MAXLOGSIZE)
PIPC.log files are pure text format and can be read with editors like notepad.exe
Using a 3rd party editor that supports syntax highlighting is reasonable.
The pipc.log is being replaced with the PI Message Log over time.
1.2 PI Message Log
File names of the PI Message Log (aka PI Server Log or PI SDK Log) are pimsg_*.dat where * is for a 7 digits number that represents the start date of the particular log file. E.g. pimsg_1120731.dat is from 31-Jul-2012. PI Message Logs are of binary format and usually opened exclusively by PI Message Subsystem service.
On a PI Server, PI Message Log files are located in the PI\Log folder; on clients and interfaced nodes, also called PINS nodes, the folder is PIPC\Log.
The PI Message Log is the most important log these days when working with PI System products.
In case PI Message Subsystem service is down or unresponsive, messages are sent to the Windows Application Event log. As soon as PI Message Subsystem becomes responsive again it migrates (but does not move) messages from Windows Application Event Log into the PI Message Log.
PI Message Logs expire after 35 days. This is controlled and configurable by the tuning parameter MessageLog_DayLimit, introduced with PI SDK 1.4.0.416 (PI Server 3.4.380 SP1 and 2010 SP1). Starting PI SDK 1.4.0.416 some tuning parameters are supported on PINS nodes. Piconfig.exe is used maintaining local tuning parameters.
1.3 PI SDK trace logs
PI SDK tracing can be used to log additional information about PI SDK calls. AboutPI SDK.exe (PI SDK earlier than version 1.4.0) or PISDKUtility.exe (since PI SDK 1.4.0) can be used to enable the tracing.
You may be asked to enable tracing and to send the resulting files for analysis when troubleshooting an issue with OSIsoft TechSupport.
1.4 Windows Event Logs
Application failures such as a crash of a PI Subsystem will cause a corresponding failure being logged into the Windows Application Event Log.
Sometimes we find related messages in the Windows System Event Log.
I usually do also request the Windows Security Event Log but don't remember a single case it provided any additional insights.
Some OSIsoft products maintain their own Windows Event Log like the PI Asset Framework (AF).
2. What are the tools for PI Message Log analysis?
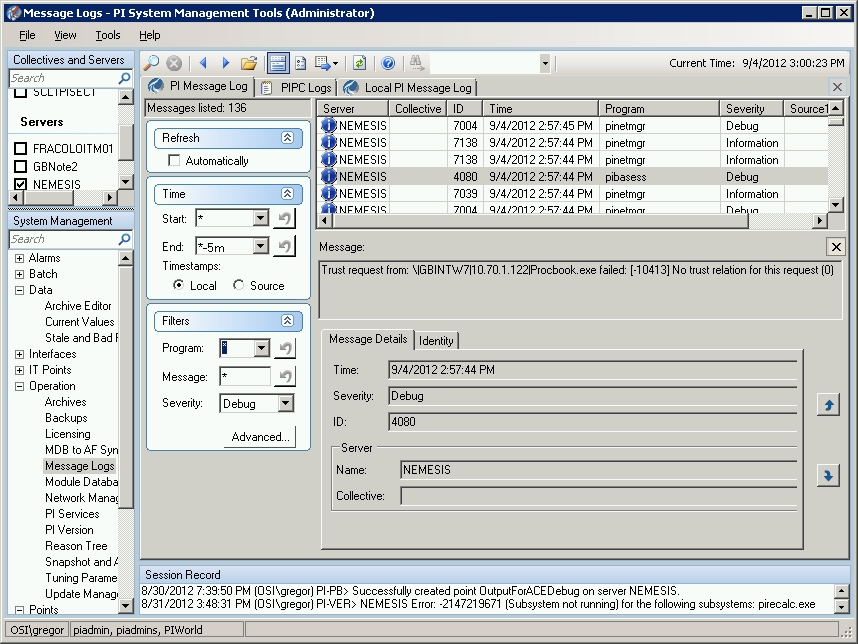
2.1 PI System Management Tools "Message Logs" plug-in
PI System Management Tools setup is included into the PI Server setup kit but available as a separate setup too. It can be installed on PI client machines and PI interface nodes.
The "Message Logs" plug-in (Operation -> Message Logs) is a Graphical User Interface similar to Windows Event Viewer (eventvwr.msc). It expects a start- and end-time definition. Logs can be filtered by severity, source and strings that may show in the message body. Resulting log messages are displayed in a table and additional info is displayed for the selected entry. All or just selected messages can be exported as comma separated, XML, text or rich text format file.
2.2 The pigetmsg.exe command line utility
It's time now outing myself as a command line addict. When using pigetmsg.exe for message retrieval a connection to PI Message Subsystem is established for communication. This does not only work locally but also over the network. Supported protocols are Explicit Login, PI Trusts and Windows Integrated Security (WIS).
An OSIsoft KB article is in preparation about tips and tricks related to PI Message Logs. I plan adding a link ones this KB article is posted.
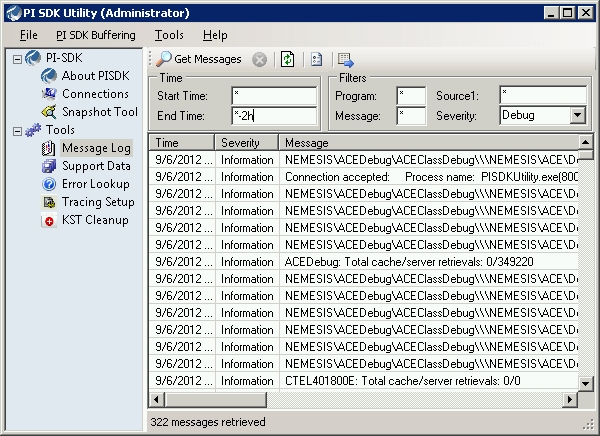
2.3 PISDKUtility.exe
A new utility that ships starting PI SDK 1.4.0 is PISDKUtility.exe
It's capable of displaying the local message log
3. Pigetmsg.exe usage - examples
The upcoming PI Server 2012 release includes several improvements to pigetmsg.exe. E.g. it will be possible to only output selected fields and message parameters. Another new feature will be the ability to create summary reports for specified message parameters. Please be sure visiting checking out pigetmsg.exe help after installing PI 2012.
I will only discuss those command line switches that I experienced being useful. Depending on the use case other existing switches may turn out being useful too. Hence I encourage you to check the command help for complete list and additional information about existing switches.
pigetmsg -?
or
pigetmsg -h
Combinations of command line switches as used in the following examples are possible.
3.1 Looking at the PI Message Log continuously
This is the recommendation being used whenever possible e.g. at PI System startup or when verifying an incoming connection attempt.
pigetmsg -f
3.2 Setting time limitations for message retrieval
Usually we like to look at messages for a period of time specified by start- and end-time. PI Time format is used.
pigetmsg -st *-2h -et *
pigetmsg -st "31-Aug-2012 13:00" -et "01-Sep-2012 10:00"
pigetmsg -st "04-Sep-2012 13:00:01.001" -et *
pigetmsg.exe command line utility expects either looking at logs continuously (option -f), specifying a period by start-time (-st) and end-time (-et) or defining the count of recent messages (-t)
3.3 Redirecting messages into text files
When testing above examples you will recognize messages are passing by in the command prompt quickly and when scrolling back up you may recognize the command line buffer became exceeded. So better to dump messages into a text file:
pigetmsg -st *-2h -et * > C:\Temp\mypimessagelog.txt
or
pigetmsg -st *-2h -et * -of C:\temp\mypimessagelog.txt
3.4 Filter messages by severity
There are 4 different severity levels with PI Message Logs. The pigetmsg.exe command line tool allows filtering by specifying the minimum severity level.
- - Debug <= this is the default
- - Information (-si)
- - Warning (-sw)
- - Error (-se)
- - Critical (-sc)
Most messages are of type Debug or Informational. Filtering them usually means reducing the amount of messages dramatically:
pigetmsg -sw -st *-2h -et *
You may want to take note of the time(s) for severe messages and check the PI Message Log for related information around that time.
3.5 Output formatting
If you prefer using a comma separated format (CSV) e.g. for the analysis with Microsoft Excel, you may find this option useful:
pigetmsg -fc -st *-2h -et *
To force having at least 2 lines for each message log entry, what as far as I've seen is the default, please use the following:
pigetmsg -ft -st *-2h -et *
The wide output format with just one line per message can be forced using:
pigetmsg -fw -st *-2h -et *
Programmers may like the option having messages in XML format:
pigetmsg -fx -st *-2h -et *
3.6 Output all message fields
By default only the most common message fields are shown.
The result when using the -oa switch will include all fields
pigetmsg -oa -st *-2h -et *
I have used CSV format to verify the field names
| Column name | Default |
| MessageSeverity | Yes |
| MessageTime | Yes |
| ProcessHost | Yes |
| ProcessName | Yes |
| Source1 | Yes |
| Source2 | Yes |
| Source3 | Yes |
| Message | Yes |
| MessageID | Yes |
| PID (process ID) | No |
| ProcessPIUser | No |
| ProcessOSUser | No |
| OriginatingHost | No |
| OriginatingPIUser | No |
| OriginatingOSUser | No |
| Category | No |
| Priority | No |
Please note that information fitting in one of the fields listed above may be included into the message body. It will only show up in the corresponding column if it has been explicitly logged to that column.
3.7 Filter by message source / process name
Valid message sources / process names are e.g. pibasess, pinetmgr, pilicmgr, piarchss and pisnapss.
If you are unsure, consult an existing log e.g. using PI-SMT "Message Log" plug-in. Results of the following commands are the same.
pigetmsg -src PIACEClassLibraryHost -st *-2h -et *
pigetmsg -pr PIACEClassLibraryHost -st *-2h -et *
3.8 Filter the message body by a specific string
This is one of the most powerful options if you know what you are looking for e.g. messages regarding a particular PINS node identified by name, FQDN or IP address. An asterisk (*) is the wildcard for multiple characters and a question mark (?) replaces just a single character.
a) Filtering by IP address
pigetmsg -msg *10.17.10.80* -st *-2h -et *
b) Filtering by point ID:
It depends how point ID's are referred to. Sometimes we see only "ID: <ptid>" what may confuse with connection ID's
pigetmsg -msg *point ID: 995* -st *-2h -et *
On a large PI System there might be multiple tags with point ID's starting with 995. Hence you may want to make the search string a little stronger by adding a trailing blank:
pigetmsg -msg *point ID: 995 * -st *-2h -et *
c) Filtering by connection ID:
To filter e.g. a PI Server's log for messages generated for a particular connection, one can look up the connection ID in PI Network Manager Statistics and use it to filter the message body.
pigetmsg -msg *ID: 234* -st *-2h -et *
d) Filtering for PI error numbers
PI Error messages are represented by negative error code numbers. These error codes do usually show enclosed into square brackets and are of 3 to 5 digits in length. Some examples:
| Error # | Translation |
| [-102] | Record Not Found (Empty) |
| [-11202] | PI-Redirector could not get archived data from foreign system |
| [-10466] | No Record Available for Passed recno |
Please see chapter 5 "Looking up error codes" for more information on PI error codes.
One can filter for particular error codes:
pigetmsg -msg *[-11202]* -st *-2h -et *
a little bit more laid-back:
pigetmsg -msg *[-???]* -st *-2h -et *
pigetmsg -msg *[-????]* -st *-2h -et *
pigetmsg -msg *[-?????]* -st *-2h -et *
or totally stress-free:
pigetmsg -msg *[-*]* -st *-2h -et *
e) Filtering for "Errors"
Filtering for typical keywords such as "failure", "failed", "error" ...
pigetmsg -msg *fail* -st *-2h -et *
3.9 Generate a summarized report sorted by the number of occurrences
This option doesn't return any message details but counts the amount of messages for the specified field and sorts the returned list by the amount of occurrences top to bottom.
pigetmsg -top pr -st *-2h -et *
pigetmsg -top pid -st *-2h -et *
4. Tools for PI Message Log analysis
Based on the different output formats supported (TXT, CSV, XML), one may want to choose different tools for analysis.
4.1 Analyzing text files (.txt)
My personal preference still is notepad.exe but sometimes, with very unclear logs filled up by an almost uncountable amount of sources, I wish I would have a more comfortable tool.
I know there are text editors that support syntax highlighting but I never spent the time checking which one may fit my requirements. If you have any recommendation for me, please don't hesitate answering to this post.
Notepad.exe find function allows you to search for keywords that you have evaluated being useful like "error", "fail", "[- " and so on.
If I am more interested in recent messages than in how things have developed over time, I am using the [Find...] functionality bottom up.
When analyzing my first message log I started reading at the top and was wondering if I would be able to finish through the log before the end of the day. Seeing the same kind of messages, repeating again and again turned out being boring lecture. Before finishing the first page, I started scrolling through the log using the down arrow on my keyboard. Whenever I recognized a change in pattern, I stopped scrolling and looked more detailed. At least for me this method is working and it's one reason why I prefer pure text files above other options.
4.2 Analyzing comma separated files (CSV)
You may like loading comma separated logs into Microsoft Excel and using Filter and / or Conditional Formatting. I can also imagine one or the other may use VBA code for automated searches or aggregation of messages suspected being serious.
4.3 Analyzing XML files
XML files are somehow like very basic databases with each value being enclosed into a field tag. I am curious about your suggestions on what tools can be used for PI Message Log analysis when working with XML format.
5. Looking up error codes
If an error code shows in PI Message Log and you are unsure what it is about you can use different tools to lookup the translation of a particular error code.
5.1 AboutPI-SDK.exe / PISDKUtility.exe
Starting with PI SDK 1.4.0, AboutPI-SDK.exe utility is replaced with PISDKUtility.exe
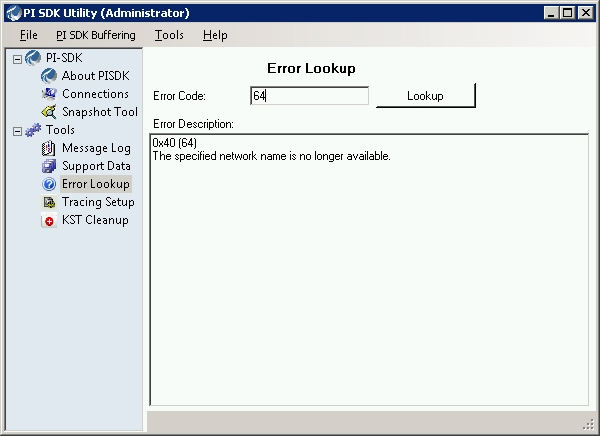
As you can see in above screenshot, not only PI Error codes are supported.
Error codes can be decimal or hexadecimal. PISDKUtility.exe displays both but sometimes the logs have error codes supposed being hexadecimal but without the leading "0x" e.g. 80004005. In case the utility returns "Unknown System Error" you may want to try adding the leading "0x" (0x80004005).
5.2 Command line tool pidiag.exe
Alternatively pidiag.exe can be used for the translation of error codes. Some examples:
D:\PI\Adm>pidiag -e 64
[64] The specified network name is no longer available.
D:\PI\Adm>pidiag -e -11057
[-11057] Not Enough Values For Calculation
6. General considerations
PI Message Logs can grow large. I have seen log files with up to 100 MB on large PI Systems and interface nodes with several instances of different interfaces. For sure 100 MB is by far more than what can be reviewed on a daily basis. I recommend using enhanced debugging options only in case of an issue that requires investigation.
Especially when dealing with multiple interfaces instances of the same type on a single machine, it becomes important to name instances in order to have useful information being logged. The ICU creates a name for each new interface instance added. You may want to make interface names unique e.g. by adding a few letters that help you to identify the source. Please verify after installing new interface instances that the PI Message Log (or pipc.log with interfaces using UNIINT < 4.5.x) clearly identifies what instance has written particular messages.
7. Final comments
Dealing with logs isn't an easy business but it is not rocket science. If you know your tools, it becomes easy.
Whenever you are facing issues related to PI products, please do not hesitate to contact OSIsoft TechSupport. The same applies if you are unsure if a particular message is indicating a serious issue or not.
I plan enhancing this post over time by adding information e.g. about using "PowerShell Tools for the PI System" for log file analysis. A colleague recently gave me a hint on using Microsoft LogParser that allows using SQL-like syntax to query all sort of files. Besides PowerShell it looks like another tool for powerful and effective log file analysis. Currently, I am curious what's possible.
I hope you like this post and maybe you learned a few things that will be of use for you in the future. I am looking forward to receiving your feedback.
Gregor


