

The PI System Status Monitoring (PSM) example kit is aimed at PI System administrators and support personnel and helps them learn how to apply Asset Framework concepts to continuously monitor the status of PI System components using PI System infrastructure. The example kit is used to model a PI System environment, and several KPIs are calculated based on best practices for monitoring PI System components. These provide a starting point for an asset-based monitoring deployment.
Monitoring the status of PI System components helps protect the investment made in the PI System and improve data quality. End users not getting PI System data when expected can be a meaningful loss. Customers can become proactively aware when components of the PI System infrastructure are not working as expected, and quickly troubleshoot issues. In many cases poor data quality results from gaps in time series data. The PSM example kit shows how to monitor data flows into the PI System and alert when there are issues. Actions can then be taken to restore the data flow, resolve the root cause, and potentially reduce or prevent data loss.
The AVEVA Success Services team offers a workshop service to teach customers how to deploy the PSM example kit and guide them through building an AF structure to model their PI System environment.
The kit contains example templates for various PI System components. Templates are deployed to match the customer’s PI System environment. The templates use standard PI System functionality to gather and store time series performance data, analyze data for known patterns, organize anomalies into event frames, and notify with basic troubleshooting instructions.
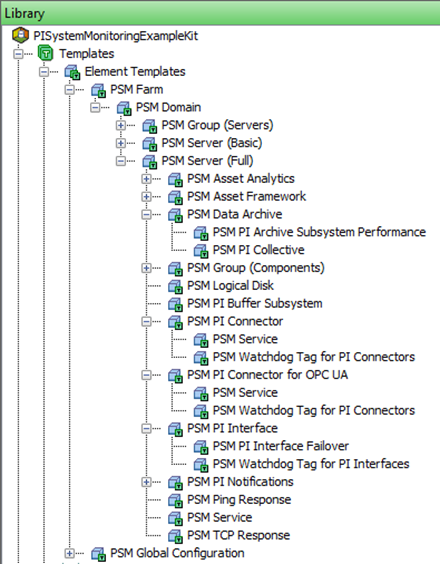
Some of the KPIs monitored by the PSM templates:
- PI Interfaces (OPC DA/HDA, PItoPI, RDBMS, Modbus, etc. anything based on UniInt) – overall health, and failover status, along with watchdog tags for source data flow
- PI Buffer Subsystem (ensure the data is getting through) - overall status, events out of order, queue capacity)
- Data Archive - archive issues, compression, cache usage, queues, out of order events, backups, all subsystems, etc.
- Asset Analytics - latency, skipped evaluations, cache issues, service health
- PI Notifications - rule errors, failed sends, service status
- Asset Framework – general health (includes connection to SQL Server)
- PI Connectors - service status, watchdog tags for source data flow
- PI Integrators – service status
- Windows machine monitoring – CPU, RAM, disk space
- Any Windows service - general status
The PSM example kit also includes templates for other PI System diagnostic interfaces outside the example kit that can be used with it:
- PI Ping interface (network connectivity and latency)
- PI TCP Response interface (response times).
A customer-built solution based on the PSM example kit can provide PI System administrators with direct access to diagnostic alerts to resolve PI System performance issues themselves. The kit may be customized or expanded by the customer to build an alternative (not a direct replacement) to Managed PI and the Network Operations Center (NOC) service from AVEVA. A solution based on the PSM example kit runs solely on the customer’s PI System and the customer has direct access to all notifications and visualization of the monitoring KPIs – PSM is administered entirely by the customer. If the customer chooses to engage Tech Support to troubleshoot detected issues, they can work cases faster and more accurately using the historical data trail created by PSM.
The PSM example kit helps customers use PI System best practices and save time when deploying status monitoring for PI Systems:
- Illustrates a parent/child element template design using references to deploy status monitoring for PI Systems faster and more consistently
- Illustrates best practices for event frame generation, work by exception methods, critical naming patterns, and notification formatting
- Base data streams configured by example kit - flexible and can be customized to use any data stream found in Windows Performance Monitor
- AF templates create all required PI Tags and synchronize PI Tag properties (such as exception and compression) from template
- Analytics can be tuned to each instance at runtime
The PSM example kit has been developed as a learning tool to provide guidance to customers as they deploy monitoring using the PI System. The kit is not intended to provide a complete solution for monitoring a PI System, and the example may be missing key requirements for a production environment. We encourage end users to review all aspects of the kit and modify as needed for their own processes and equipment.
How to get the PSM example kit:
The PSM example kit is delivered to customers in a service engagement from AVEVA Success Services. The service engagement will coach the PI administrator(s) on all aspects of the kit. Ask for a Workshop and specify the PI System Status Monitoring (PSM) example kit.
Contact your local OSIsoft Account Manager or OSIsoft Customer Success Manager to schedule this service.

