

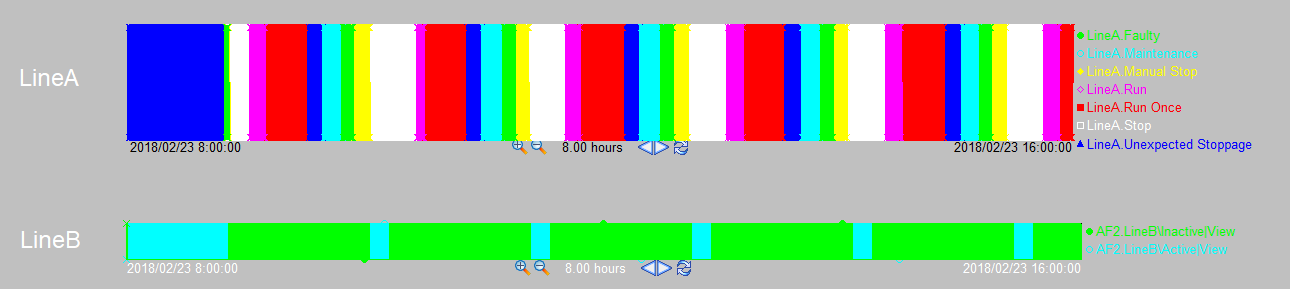
In the manufacturing world, it is common to visualize how well a particular line by visualizing in simple Gantt charts.
There are much nicer visualization that could be done using PI Vision custom symbols. Better yet, request it as a standard symbol: Event Gantt Symbol – Customer Feedback for OSIsoft & the PI System
In the meantime, here is a simple way to do so using a few tags (each color below is one tag)
Here is the final results as seen in PI ProcessBook
Note: In PI Vision, this can be recreated using a custom symbol. Here is a sample that does similar using the amcharts library: PI-Vision-Custom-Symbols/Community Samples/OSIsoft/amcharts-stringValuesPlot at master · osisoft/PI-Vision-Custom-Symbol…
The way this is organized, is in AF I have a parent asset that represents the line and the child of the Line element is all the possible states the line can be.
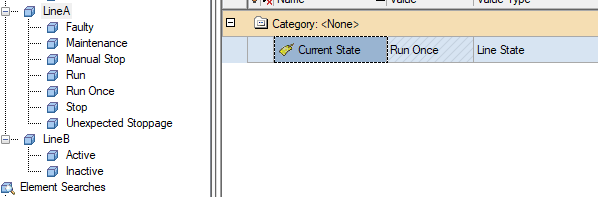
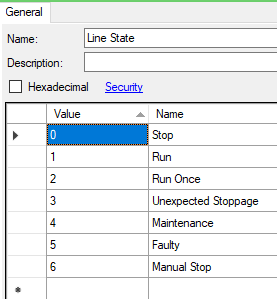
The various states of the line are organized in a AF enumeration set, which is used by the "Current State" of the Line element.
Each individual child element will produce one color in the graph above.
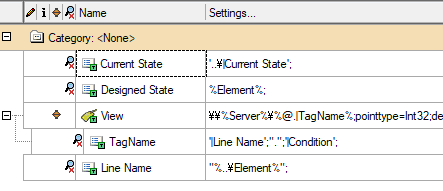
Here are the data types and the required attributes. As I don't want to have a template per enumeration set, I use strings instead of enumeration values.

And here is the whole trick to the visualization.

If the state of the line, matches the name of the element, then I will the expression will change the value of View from 1 to 0 or 0 to 1 (True to False and False to True).
That is it!
The analysis does not need to run very frequently, the above graphs is done with 1 minute frequency
The rest of the trick is in PI ProcessBook, to only show values from 0.4 to 0.6 to avoid seeing what happens around 0.
Here is the configuration of the template
-

Community User
-
Cancel
-
Vote Up
0
Vote Down
-
-
Sign in to reply
-
More
-
Cancel
Comment-

Community User
-
Cancel
-
Vote Up
0
Vote Down
-
-
Sign in to reply
-
More
-
Cancel
Children