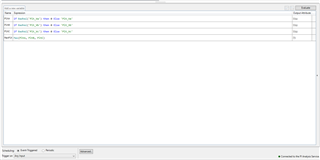
Currently we have this formula set up. It basically just gets the Max value of the 3 raw tags to get the count.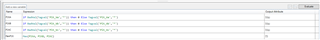
Our issue is for some reason it doesn't match the count of the Raw tags and the Analysis tags.
Analysis tag count: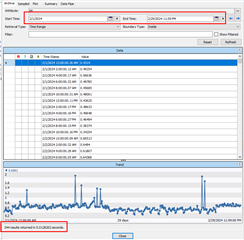
Raw tag count: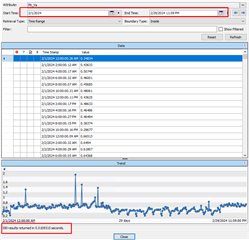
and also whenever I checked in Preview Result it gives me 348 count.
We have tried backfilling it and it works but it keeps on recurring so I don't think backfilling always would be efficient.
Can you guys help me or suggest what else can be done to get a more accurate readings.