I want to count the number of piles of pulse-shaped data.

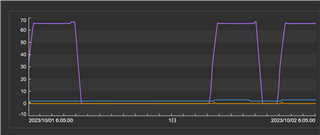
The data shown in the figure is obtained(purple line).

We want to count the number of piles of such data.

Is it possible to implement this in an event frame or in an analisis?

Best regards.

Parents
  • Option 1: Count number of events above a threshold ArrayLength(FilterData(RecordedValues('PurpleLineAttribute','StartTime','EndTime'), $val> "value above threshold"))

    Option 2: If you are planning to count cycles then create another analytics and use it as a flag e.g. If PurpleLineAttribute >"value above threshold" and PreviousValue of PurpleLineAttribute < "value above threshold" then counter = previouscountervalue +1 else NoOutput()

Reply
  • Option 1: Count number of events above a threshold ArrayLength(FilterData(RecordedValues('PurpleLineAttribute','StartTime','EndTime'), $val> "value above threshold"))

    Option 2: If you are planning to count cycles then create another analytics and use it as a flag e.g. If PurpleLineAttribute >"value above threshold" and PreviousValue of PurpleLineAttribute < "value above threshold" then counter = previouscountervalue +1 else NoOutput()

Children
No Data