Hello,
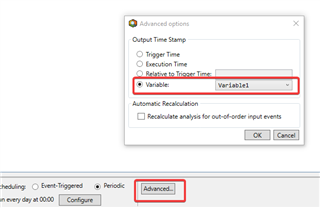
I have an EF analysis that calculates the peak (max) values; filters it through some limits and writes it out to an attribute (saves output on a tag).
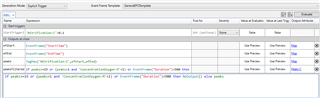
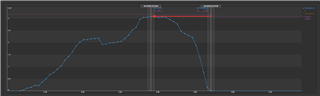
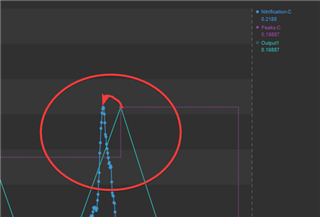
Since the write out happens at EF close, the timestamp of the peak value is later than the EF end time and the actual peak (max) value. How can one calculate the peak value on its actual occurrence timestamp and show it on a chart?