How can I create a constant line from the last value on PI Vision?

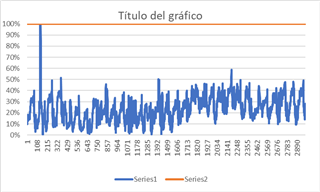
As seen in the image (Orange points):


image.png.png
Each end of the month a value of the Power Losses is calculated on a monthly basis, however, what is wanted is a constant line that maintains that last value as a line per month, roughly like the following example:


image.png
 

  • Just tested in my install of PIV2022. The behaviour seems to be to draw a straight line from the last data point to the present moment, which is I think what you want. The likely problem here is scaling, which in your case seems to be from zero to zero... it may also not be helping that the lines are on top of each other. Try plotting only the one signal and see what it does.