

Hi there,
I am having trouble grasping the concept of following knowledge article and I am seeking help or further input:
"Is it possible to see the result of an "Outputs at close" Evaluation on a client while an Event Frame is still running?" https://customers.osisoft.com/s/knowledgearticle?knowledgeArticleUrl=000038216
Here is what I am trying to do:
I work for a small chemical company producing resins in reactors. I'd like to track exothermic reaction phase in an event frame and compare event frames on different production batches.
I can manage to create the event frames for my desired phase and compare them visually using Pi Vision, but now I'd like to do some running/continious calculations.
Mainly I want to compare the heat flow around the reactor to compare the reaction phase between batches in real time. The heat flow itself is a Pi Point from our process control system.
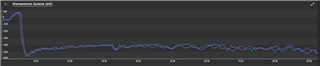
I'd like to create a running total (time integral) for these trends inside the event frames to compare the exothermic reaction in realtime regarding the energy conversion.
I can get the total value, when using an output expression (outputs at close), but then I get no trend.
I tried to follow the steps in the knowledge article, using the average as an example to create a runnig average trend:
Element attribute with value retrieval method:
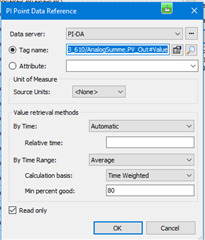
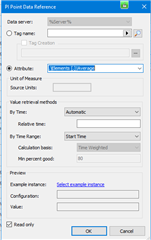
Data reference for event frame template using start time:
but doing that, the average mimics the value of the Pi Point:
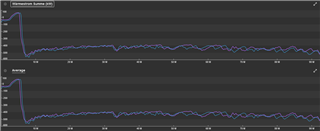
and there is no difference between the values.
It references the correct Pi Point, but seems to ignore the value retrieval method.
After that, I found a three year old post from Roger Palmen:
"An alternate approach would be to use an EventFrame atttribute using PI Point Datareferenc that refers to Rotorspeed or Power attributes on the parent element, and returns the Average or Maximum. When used on an eventframe, the PI Point DR will use the EventFrame start- and end-times"
s://pisquare.osisoft.com/s/question/0D51I00004UHj4aSAD/event-frame-generation-and-output-expressions
But when trying that, I also get the same values for the average and the Pi Point values.
After that, I found this 6 year old article:
This is basically what I am after, and in the end there is the following sentence:
"The possibility to run some calculations during an opened event frame will be added to the next release of Analytics (2017 R2)"
Any help creating a running time integral (or other analytics in general) in real time for a Pi Point inside an event frame or links to other references are much appreciated.
Thanks in advance
Kai
