Hello,
I have a PI tag thats giving a value every couple of minutes and I would like to plot those values and calcualte the area under the curve. How can I do that in PI Asset Framework?
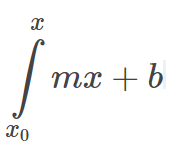
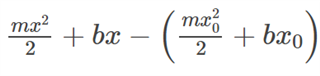
So, first getting the equation of a line y=mx+b then using that for the integral over time
Thank you,