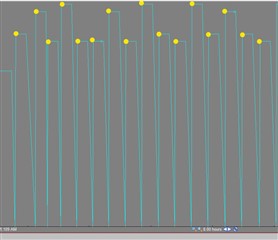
In excel, how would I pull only the Pi data points I have highlighted in the graphic attached? I'd like to filter the zeros out but I can't filter all duplicates, only a duplicate data point on the right side of the plateau if the left side is the same. I don't need timestamps. Just the left side of the plateaus I'm looking for. I'm looking to output these numbers for a 24 hour span from 6-6 daily for all points. The times at which these certain points arise is random. The ups and downs can be much tighter or wider depending on production speeds.
Thanks