Hi all, I'm searching for some functionality in Vision that was available in Processbook.
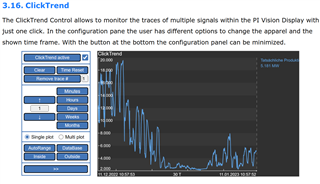
On a display depicting a continuous process, there are several tags as values on the page showing the current temperatures, flow rates, and pressures. There is a graph at the bottom of the page. The data in this graph can be changed just by clicking a tag in the display.
I can't find this functionality in PI Vision. The closest thing seems to be the asset switching feature, but that doesn't exactly serve the purpose in this situation.
here was a feature where in a display a chart could be configured to automatically fill with data from a tag that was selected on the display.


