Trends with multiple time ranges in PI Vision

Hi,

I am working on a solution where I need to show the daily trends along with a year to date trend on a PI Vision dashboard.  I understand that this feature is not available with PI Vision 2017 and I could not think of a workaround to implement this using PI Analysis. However, there is one other alternative, which is to embed a PI Vision display inside another PI Vision display using the embedWebPage custom symbol. The downside of this workaround is that we need to create multiple displays to build one dashboard. What do you think about this? Is there a better way to set multiple time ranges for trends and custom symbols on PI Vision 2017?


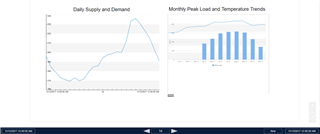
Here is my test display with multiple time ranges:


pastedImage_2.png.png


Thanks,

Adi

Parents
  • Hello, just looking at this quote from above:


    "you could explore the possibility of making the time range whatever you want for the custom symbol since it doesn't have to get the timerange from the webpage unlike the built-in symbols."


    We have a custom symbol which is fed by a single tag value using the value data shape. It must stay at the current time and cannot be altered by the use of the main display navigation arrows.


    Is there a way to achieve this in the custom symbol code?

Reply
  • Hello, just looking at this quote from above:


    "you could explore the possibility of making the time range whatever you want for the custom symbol since it doesn't have to get the timerange from the webpage unlike the built-in symbols."


    We have a custom symbol which is fed by a single tag value using the value data shape. It must stay at the current time and cannot be altered by the use of the main display navigation arrows.


    Is there a way to achieve this in the custom symbol code?

Children