Hello ,
I'm facing errors and bugging during runtime ,
The runtime became so slow after working and opening windows for one day for example ,
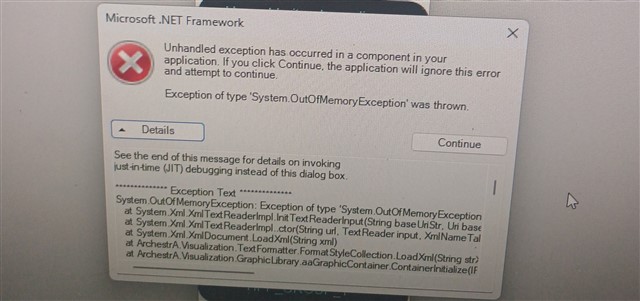
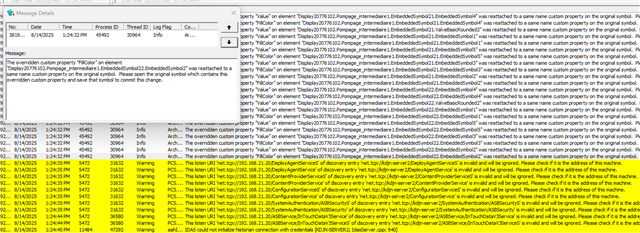
Sometimes It shows the below error related to .NET Framework
Hello ,
I'm facing errors and bugging during runtime ,
The runtime became so slow after working and opening windows for one day for example ,
Sometimes It shows the below error related to .NET Framework
Hi!
This is a pretty generic error message that need some context to sort out, but it seems to originate from an Industrial Graphics Symbol.
But I would personally start looking in to identifying any kind of memory leak, set up some monitoring of memory consumption of view.exe, or just see if you can provoke the issue and keep Task Manager running, if memory consumed starts to go up after a while of running the application you can start going further from here.
Things to keep an eye out for:
Is there a specific window or symbol open when this happens?
Can you se burst of memory consumption that is not released in a specific window or symbol?
What is the general memory consumption of the machine when this happens? (are there any other processes consuming unusual amount memory).
If there is no indication of a memory leak it could be some logic in your symbols that runs away with your bytes, so finding what component or symbol that is the root cause of the issue is crucial.
If the cause is an AVEVA component such as a .Net based alarm list, trend client etc. you need to contact support, but if it is some custom logic you have created it needs some more investigation first.
There is much to say about what could be the reason for a memory leak, but lets see what you are able to sort out first.
Also techsupport are quick to reply if this is a known problem, I could not identify this error in any of the release notes from the latest patches, but since you do not provide what version you are using it might be some things to check here too.
Thanks Richard for your reply ,
I'm using AVEVA InTouch HMI 2023 R2 with Patch 01
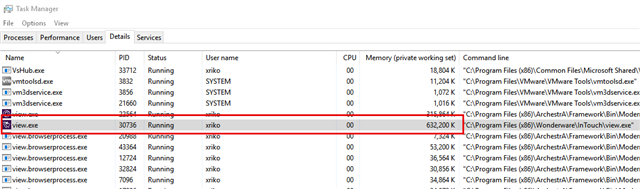
I've noticed many times that after a random duration the memory consuming is going up as you said ,
It doesn't happen because of a specific window or symbol , It happens randomly ,
However the below are some warnings recorded in the log viewer ,
I will check them but I'm confused does those errors causes this problem of hanging and consuming a lot of memory ? 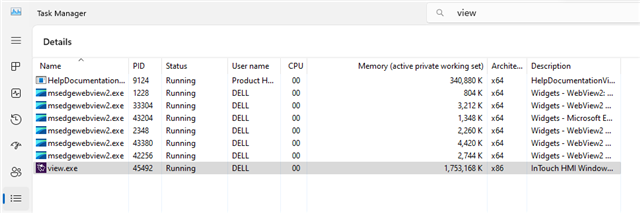
Thanks Richard for your reply ,
I'm using AVEVA InTouch HMI 2023 R2 with Patch 01
I've noticed many times that after a random duration the memory consuming is going up as you said ,
It doesn't happen because of a specific window or symbol , It happens randomly ,
However the below are some warnings recorded in the log viewer ,
I will check them but I'm confused does those errors causes this problem of hanging and consuming a lot of memory ?

Ok,
Almost 2gb of ram could be considered quite high for an InTouch application, but its hard to say since you can end up in this scenario due to many reasons.
If you have extensive use of show symbol animations scripts and generate unique Identity for each one, then your application will consume (and never let go) of ram if not handled correctly.
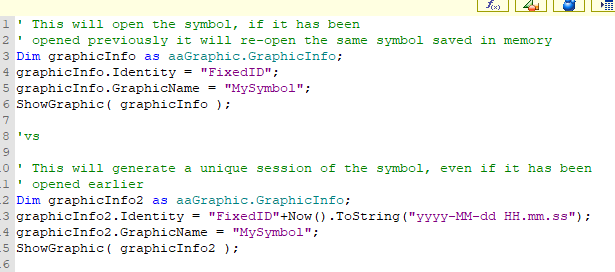
Above example is for illustration only.
I also see indications on that you are using multiple instances of web widgets and perhaps that adds to it as well.
The warning that you see can originate from this galaxy being migrated from an older version where the naming restrictions of custom properties were not enforced in the same way, and you have symbols that you have to open and save to complete the migration.
I understand the daunting task of finding exactly what causes this and it requires hands on to figure out, I would suggest that you contact techsupport to see if they have any known issues that could cause this, but eventually you have to dig down in your application to sort out how you manage the symbols and the resources they require.
You need to find your applications baseline for ram usage, ie start it up, navigate to all windows, note the memory consumption, and after this monitor the behavior over time.
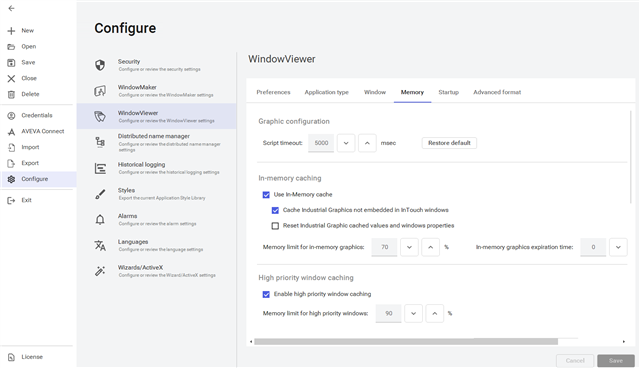
One thing to test as well, is to review the memory settings of your application, are you using in-memory cashing? You could try to temporarily turn this off do see if the behavior changes, you might end up with a slightly slower application when navigating, but it would be interesting to see how it effects memory consumption of your application.
Also, and as you are in to, sort out any bursts of warnings or messages in the logger, if you can correlate the exception with log messages it gives you something to start with.
I don't want to lead you down this quite extensive task unnecessarily, so initiate a discussion with tech support is a good thing to do.
Thank you ,
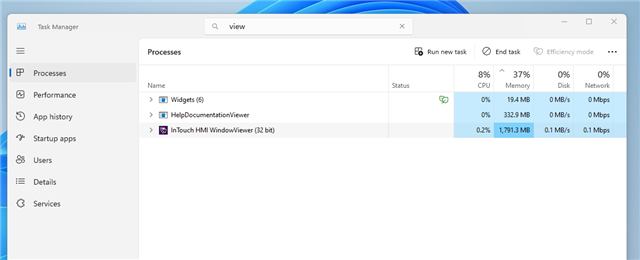
I've been made the identity as you preferred and tried this for some defined screens and symbols and kept navigating between them while the task manager is running , Unfortunately I've noticed that the memory consuming is still getting high till reaches 2.5Gb and then the program gets too much slow and shows the same message of Microsoft .Net Framework error
I also tried before to disable this In- memory cashing property , As you said It makes the navigating slower and also not making a significant difference because when trying too much navigating the memory consuming gets high .
Also I would make a case for tech. support but Is it usual for the memory consuming to get high when too much navigating ?
I would dare to say that an application that consumes 2,5+gb of ram after some usage is not normal.
And you are facing a memory leak or have some bug in your solution.
If you are using native AVEVA components only, it is very unusual. (but not impossible).
Memory leak, consumption of RAM that is never released could come from many things, but in my experience it is most often due to insufficient disposes of functions. as stated, when using native AVEVA components and script functions, then the software takes care of this.
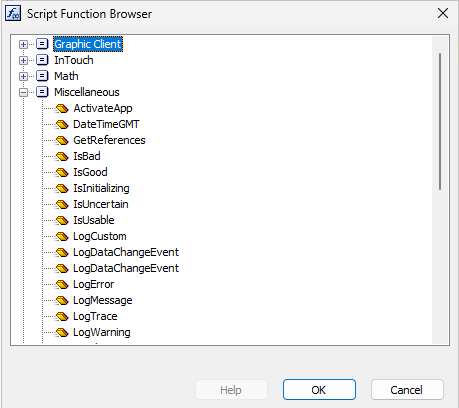
Ie, you use any of the script functions from AVEVA, then AVEVA got your back and ensures they are managed optimally when used.
It's when you start using external functions, such as SQL Access, .Net scripting, custom dll's etc. Then you need to understand how these functions manages memory.
As an example, you use SQL Scripting to retrieve a table of data, this result is put in to memory for you to use, but you do not dispose of it when done, and you execute the same query again, and again. after a while you will have all those result sets in memory (your RAM), and it will never be released until the application is closed.
Same apply if you work with custom code for XML files, json datasets, web services, and so on. You need to be sure that you release any custom data that is put in to memory, especially in your error management. .Net has good garbage collection features, but in some cases you need to tell it what to do.
Lastly we can not rule our AVEVA components entirely, but I would not focus on the features and functions that has been around for 5+ years, those has hopefully been properly sorted out by tech support and dev. team, its when you get those new features, and you are the 'first ones' to try them, extensively, where you could run in to unexpected problems. For example we now see the introduction of Web Widgets, and if you are using these extensively, you might run in to something that AVEVA dev has not tested or predicted how they are used.
So to summarize, the problem you are describing is not normal behavior, and to sort it out you need to start looking at how your solution is built and what is eating away at your RAM.
Tech support has some tools to monitor this in some cases, and I trust that they can guide you forward, but for us on the forum to give you a straight up answer without looking through your solution is going to be a challenge.