It is possible to add bar graphs and pie charts to a graphics page in AVEVA Plant SCADA using the built-in Graphics Builder tool. Your best option for pre-built objects is to use the Situational Awareness Library.
Bar graphs: Use the XY Bar Graph object, which allows comparing sets of related process variable (PV) values from similar equipment. In Graphics Builder, you can insert this object onto a page and configure it with data sources for dynamic visualization. docs.aveva.com/.../1206367.html
Pie charts: Use the SA_PieChart symbol. This is a circular graphic divided into slices to represent percentages of individual values relative to a total. In Graphics Builder, include the library project, then add the symbol to your page and bind it to data tags for real-time updates. docs.aveva.com/.../69811.html
Both can be customized with colors, labels, animations, and data bindings to reflect process data.
Also have a look at the ExampleSA project for examples of these objects being configured and used on pages.
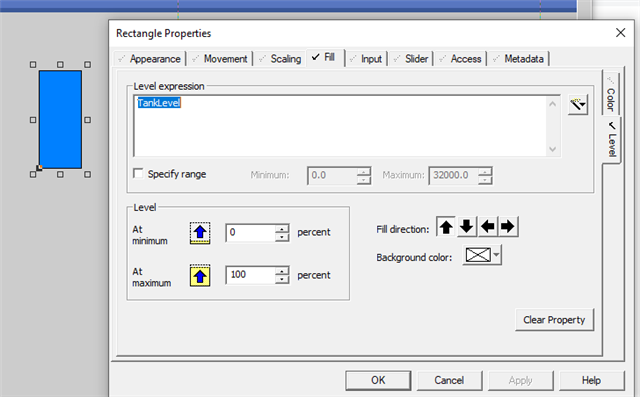
For simple bar charts, you can use the Fill properties with basic objects. For example, a rectangle can become a bar graph by using the Fill (Level) properties:
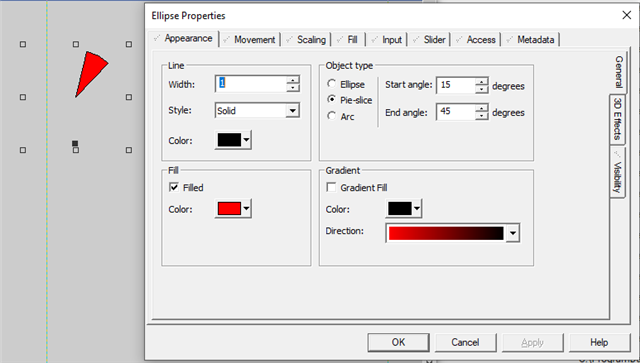
I'm not sure about pie charts. You can use an ellipse object and set it to Pie-slice type and specify the start and end angle. However, the angle won't change in the runtime.
You could probably find an ActiveX charting object that you could install on your PC. Go to the Graphics Builder's Edit menu and choose Insert ActiveX Control. You can then link SCADA variables to properties of the object to animate it.