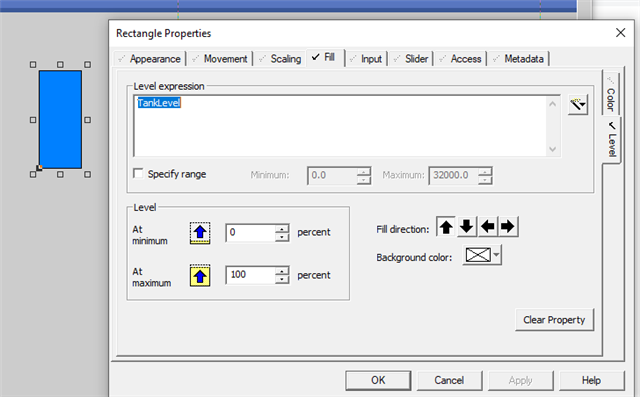
For simple bar charts, you can use the Fill properties with basic objects. For example, a rectangle can become a bar graph by using the Fill (Level) properties:
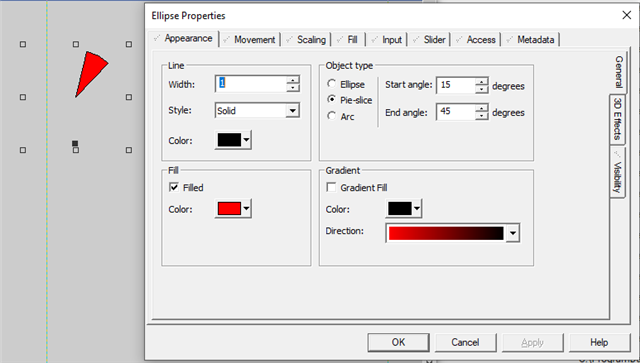
I'm not sure about pie charts. You can use an ellipse object and set it to Pie-slice type and specify the start and end angle. However, the angle won't change in the runtime.
You could probably find an ActiveX charting object that you could install on your PC. Go to the Graphics Builder's Edit menu and choose Insert ActiveX Control. You can then link SCADA variables to properties of the object to animate it.
For simple bar charts, you can use the Fill properties with basic objects. For example, a rectangle can become a bar graph by using the Fill (Level) properties:
I'm not sure about pie charts. You can use an ellipse object and set it to Pie-slice type and specify the start and end angle. However, the angle won't change in the runtime.
You could probably find an ActiveX charting object that you could install on your PC. Go to the Graphics Builder's Edit menu and choose Insert ActiveX Control. You can then link SCADA variables to properties of the object to animate it.