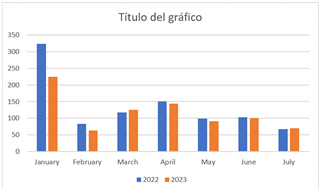
I want to show a bar chart comparing monthly losses in two years. As follows:
Hi, you can do that pretty easily with Combo Chart Plus for PI Vision, see the example screenshots: https://www.software-athlete.com/products/combo-chart-plus