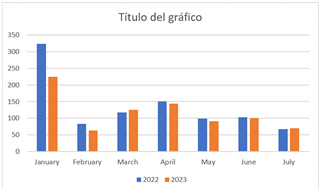
I want to show a bar chart comparing monthly losses in two years. As follows:
How can I set it to monthly aggregation?